OpeX Liquidity Where the options market is positioned, and when it got there.
Options research tool · 2026 · Product owner and design director, working with AI agents
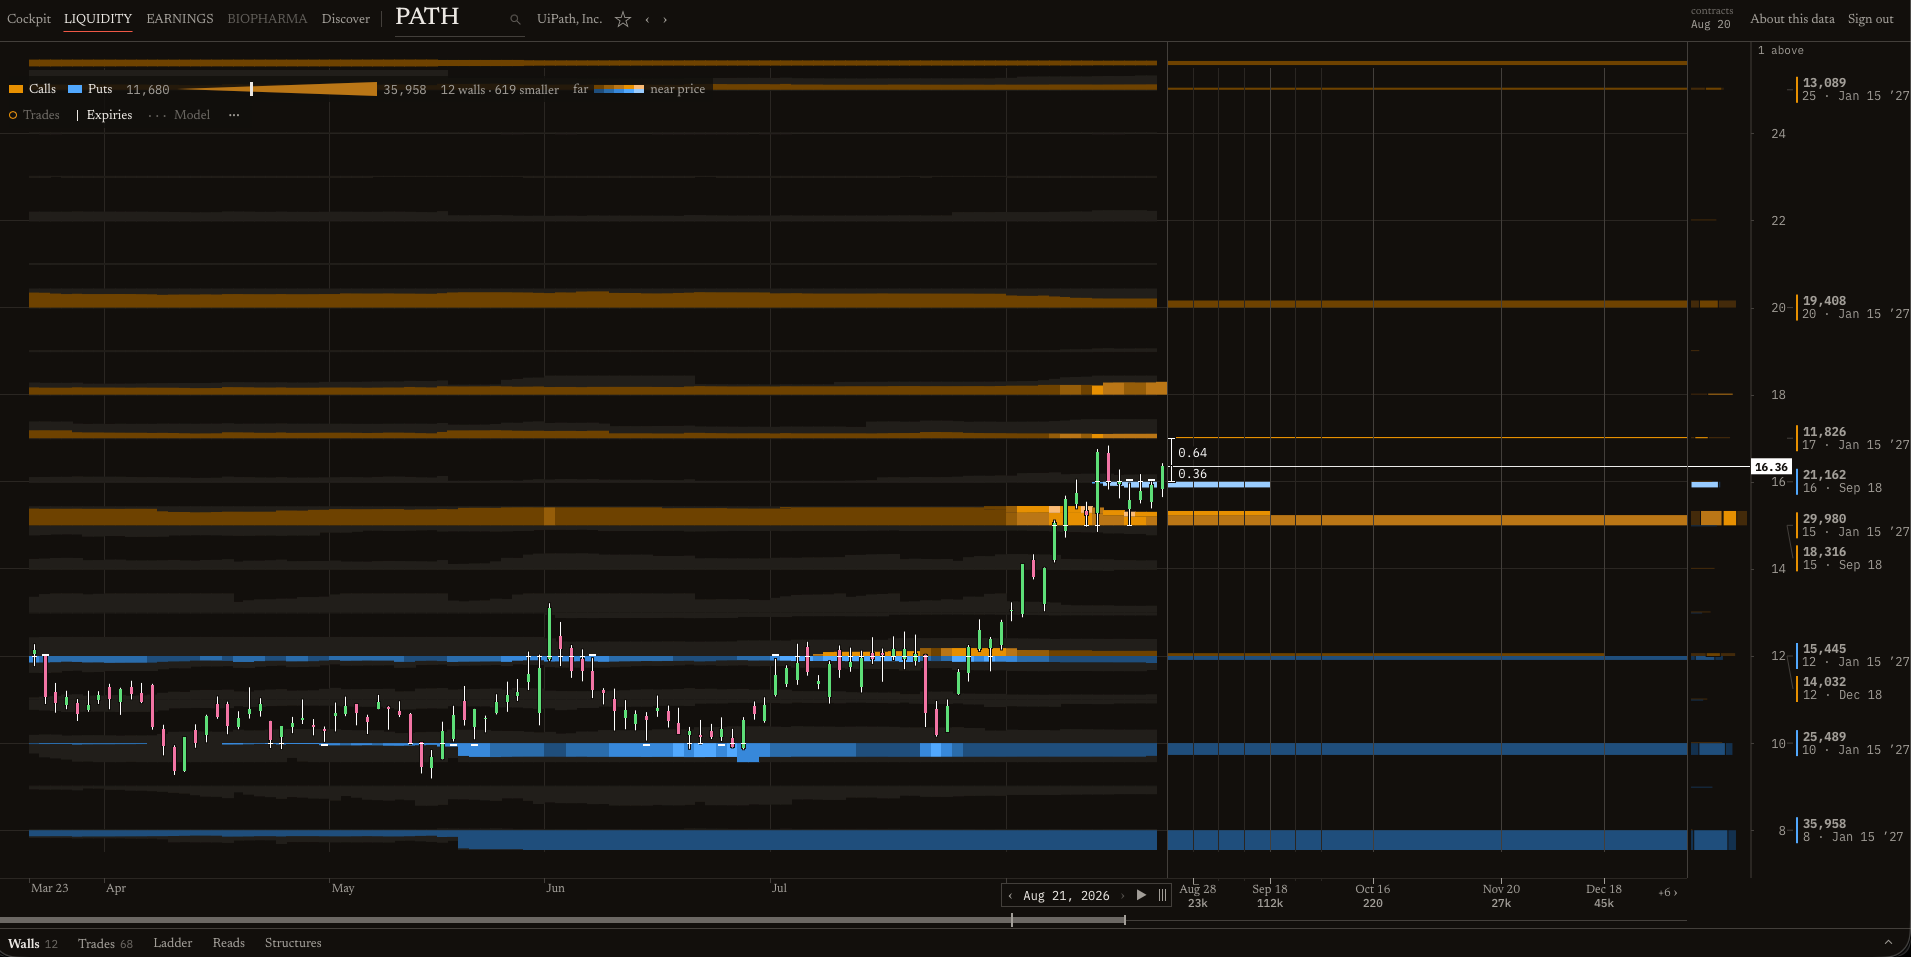
Liquidity's main view, the field, draws a stock's open interest at every strike, day by day, around the price. It keeps every contract's history, including contracts that have expired, and never shows a number before the day it was published. It runs privately in the cloud for one user.
The problem I've traded options for decades. The data I wanted existed, but no tool showed it the way I read a market.
Open interest is shown as a snapshot. You get today's chain or a feed of flow alerts. You don't see where positioning built up over months, when a wall of open interest formed, what traded the day it formed, or what expired.
Replays leak hindsight. Open interest for a session is published the next morning. A tool that draws it on the trading day, or classifies a trade using the next day's number, shows things nobody could have known at the time. Any backtest built on that flatters itself.
Tools claim more than the data proves. Daily open interest can't tell you who holds a contract, why they hold it, or how it changed during the day. Labels like "smart money" and "hedging" suggest it can.
The approach Start from the data's real clock. Every value carries when it happened and when it became available. On the chart, x means time everywhere: a mark in a session's column comes only from what was known that session.
Build locally, then lift. The first version ran on my Mac with SQLite, FastAPI and React. The cloud version kept its interface and API contract and replaced storage and scheduling underneath rather than starting over.
Design on real data. Every direction I chose from was a finished screen drawn on real names (AAPL, MRNA, COIN, GAP, CPRT, PATH), not a wireframe. I judged each one at my desk, at full size.
Ship thin slices through gates. A worker's result is evidence, not acceptance. Each slice went through control review, and interface slices also through an independent design review and my desk look, before a separate deploy approval.
Say only what the data proves. Modeled layers such as dealer gamma stay behind a MODEL switch and show their ranges. When a sign can't be determined, the chart says "indeterminate"; when the model can't answer, it says "unavailable."
My role I ran Liquidity as a one-person product team working with AI agents.
Product owner. I set scope, spend ceilings and licensing boundaries, and approved every deployment, migration and dataset promotion.
Design director. I chose the visual language from finished options: a printed-research look on a dark ground, the field as an x-ray, amber calls and blue puts, and a frame where the chart is the interface.
The acceptance test. Nothing shipped until it passed my first look. Several of the project's best rules came from that look failing.
Author of the rules the agents work under. OpenAI's Codex runs the control lane: it sequences work, writes bounded assignments for implementation workers, reviews their diffs and integrates them. Claude explores designs on real data and reviews builds and architecture independently. The operating model is written down (an authority matrix, a release state machine, stop-loss rules for stalled investigations) so a fresh agent can resume from files instead of chat history.
Stack Interface: React 19 and TypeScript on Vite, with a hand-built canvas renderer for the field. Hosted privately on Vercel.
Identity: Supabase Auth, exactly one enabled owner, sign-up disabled.
API: Python 3.13, FastAPI and Pydantic on an always-warm Cloud Run service. DuckDB queries Parquet directly.
Jobs: containerized Cloud Run Jobs for acquisition, transformation, reconciliation and promotion.
Storage: private, versioned Google Cloud Storage for raw provider responses and curated Parquet. Supabase Postgres for control state: jobs, leases, receipts, manifests, provider permits and the active-dataset pointer.
Data: the Unusual Whales API, under a personal-research license.
Secrets: Google Secret Manager. Only workers can reach the provider key; the serving image is built with provider calls switched off.
Delivery: private GitHub with a pre-push secret scan, Linear for the backlog, Playwright for browser checks.
AI agents: OpenAI Codex for control and implementation; Claude for design exploration and independent review.
Architecture Three data layers. Raw evidence never changes. Normalized facts carry corrections. Product read models (field, ladder, walls, gamma) are versioned and can be rebuilt from the layers below.
Two clocks on every value. Each fact carries event_at and available_at. The check is binary: for any cutoff T, every returned field has available_at ≤ T, and adding data first available after T leaves the pre-T response and its hash unchanged.
Immutable versions, one pointer. A correction creates a new dataset version. Promotion moves one pointer in a transaction, and rollback moves it back. A mutable "latest" file is never the source of truth.
No laptop in production. Production data and control state live in the cloud; the Mac is a development client.
Trade-offs DuckDB on Parquet instead of a warehouse. One user doing read-only analysis doesn't justify ClickHouse or BigQuery yet. The switch conditions are written down, such as 500 million hot rows or 20 concurrent analytical queries. The cost: dense names replay slowly, about five seconds per AAPL replay block at the median.
Two wires, not ten. In a probe, two concurrent requests ran at 35.6 per second with no rate-limit errors, while ten triggered rate limiting. Two keeps throughput predictable and stays inside the provider relationship. The cost: a full history takes days, not hours.
Pending instead of pretending. Open interest appears only after it is published. In replay, an unpublished session is drawn as hatched and pending, and while a block loads the chart shows price and the background field under a hatch, never the previous walls.
Proof before promotion. Every release carries hashes, manifests and an independent check. That slows every change, and once it slowed things far too much (see Failures).
Personal first. One owner, one license class, no sharing path. A commercial version would need a new license, separate credentials and storage, and history re-acquired under that license. Personal data is never relabeled as commercial.
Jobs and Postgres instead of a queue system. Cloud Run Jobs with durable job state in Postgres stand in for Pub/Sub, dead-letter queues and an outbox. There are fewer moving parts, but the control logic is ours to get right, and that is where most failures happened.
Failures Hindsight in the replay. The local version classified trades as opening or closing using the next morning's open interest, then drew the result on the trade day. Fixing it became a release gate: the hosted replay had to pass an authenticated no-hindsight check before promotion.
A 15-hour plan that took weeks. The full history run was planned at 15 hours, assuming about 390 requests per name. The heaviest names needed 5,000 to 15,000 each, the scheduler put them first, and the first rate-limit response aborted the whole ticker, so one run finished zero names. Later, the wires sat idle 70–86% of the time while post-fetch steps scanned a 24.5 GB SQLite file that had outgrown memory.
Process heavier than the work. An outside review counted 37 migrations and about 26,600 lines of SQL, mostly restart authorization, with roughly 1,000 new lines needed for every restart. Its verdict: keep the data plane, replace the control plane.
Words where design should be. A UX sprint delivered correctness but no identity: a second stylesheet, about 57 sentences of on-screen prose, and the chart capped at 43% of the screen height. I called it AI slop. The first "as known then" replay came back as a date line and relabeled controls, and I rejected it as a bunch of text. Later, the frame around the chart grew one acceptance criterion at a time until the as-of date appeared about seven times and time was controlled in six places. Each fix was a design round on real data, with someone responsible for removing words as well as adding true ones.
Readability the reviews missed. One ink for calls and puts looked cleaner on the design board, but on the built product I couldn't tell them apart. Separately, a size profile drawn at the chart's "today" edge painted put ink back over past sessions, so a one-day-old MRNA wall appeared about three sessions before it existed. Reviews had passed it because AAPL's walls were months old. Two rules came out of this: any category a trader names gets its word or letter on the mark, and x means time everywhere. Test on a young wall.
Continuous collection. Live capture's first session saved 2.3 million events in 5,010 immutable objects, with one unreconciled three-second gap. On the first full scheduled day the stream failed, and the daily job made zero requests because its admission was tied to a held historical job. The schedules are paused while the capture path is simplified.
Outcomes Live for one user since late August: private Vercel app, owner-only sign-in, warm API on Cloud Run, versioned data in Cloud Storage.
Served: 352 names over 106 sessions (March 23 to August 21, 2026), backed by per-contract daily open interest with expired contracts included: 47.4 million contract-day rows.
History acquired: 2,024 names through 4.7 million provider calls, kept as about 17 GB of immutable raw responses.
Pilot: 7/7 predicates. Six names, 35,287 calls, zero rate-limit errors, 16 calls per second, 11/11 temporal checks.
Shipped in slices: the x-ray redesign of the field (September 13), "as known then" replay (September 14), the new palette and the fix that moved size off the time axis (September 19), and a new frame with wheel-zoom, drag-pan, a draggable replay cursor and a trades layer (September 20–21). Drag interactions run at a p95 of 17.7 ms against a 33 ms budget, measured locally.